Data is everywhere—charts in the news, numbers on real estate sites, maps in climate reports. But just having the data isn’t enough. If we can’t see it clearly, we can’t use it wisely.
That’s something I learned the hard way.
When I first started digging into housing data, I downloaded giant spreadsheets packed with numbers—average rent, commute times, air quality scores. The information was all there, but it felt…flat. Detached. It didn’t tell me anything about what it’s actually like to live in a place.
Then I made my first map.
It was a simple choropleth — just a color gradient showing rent prices across L.A. neighborhoods. But suddenly, something clicked. You could see the patterns — how affordability faded as you moved toward the coast, how certain pockets remained stable despite development all around them.
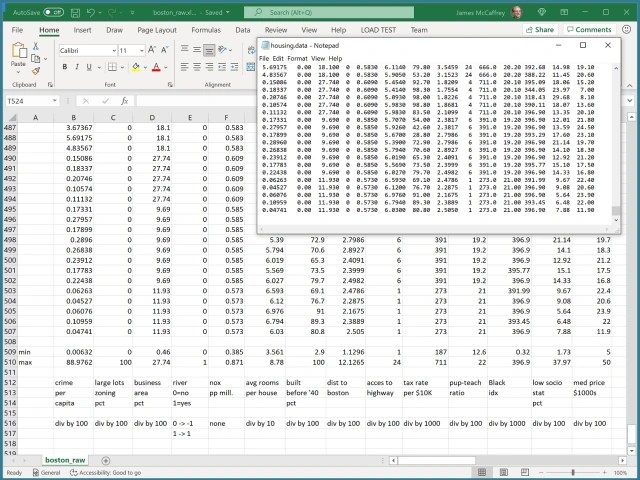
THE classic “wall of numbers” view. It perfectly captures the moment when data feels sterile and hard to interpret.
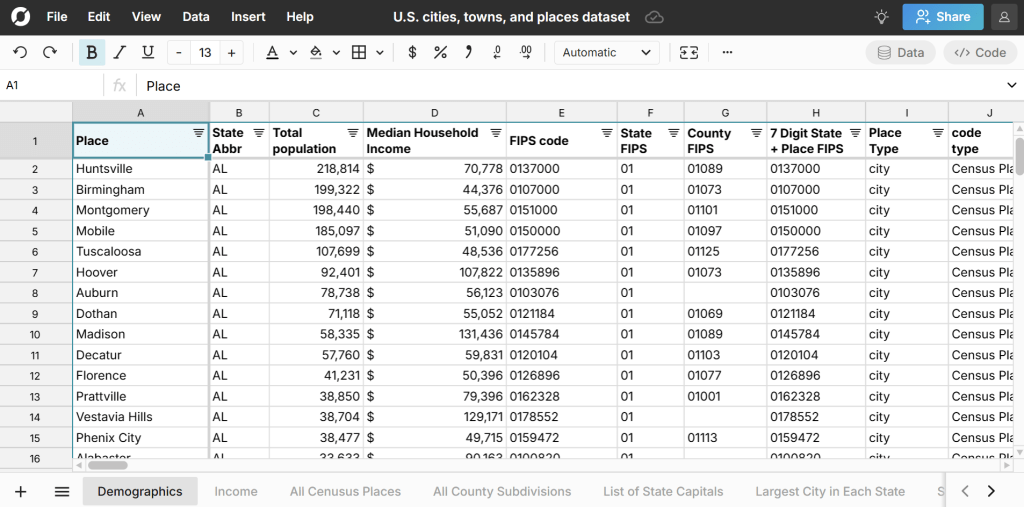
This second image displays a clean spreadsheet interface with structured columns. It’s organized clearly and could serve as a stepping stone toward more polished visualizations like charts or maps.
I realized that when data is visualized well, it stops being abstract. It becomes personal:
🗺 Maps show us where gaps exist — in transit, green space, walkability.
📊 Charts reveal trends over time — like how rent hikes outpace wages.
📌 Dashboards let people ask their own questions — not just take someone else’s answer.
Good visuals don’t just make data pretty. They make it actionable. They spark questions, expose injustices, and give people the tools to make smarter decisions.
Data means nothing without interpretation — but presented well, it becomes a powerful tool.
That’s a big part of why I created EcoScore. It’s not just about ranking neighborhoods. It’s about making invisible things visible — like poor air quality near freeways, or how few trees there are in a hot neighborhood.
Because at the end of the day, people don’t live in spreadsheets. They live in places. And when we see those places clearly, we can change them.

Leave a comment