We talk a lot about green space, transit, and walkability when it comes to livable neighborhoods. But there’s something else baked into every place we live—something you can’t always see on a map, but you definitely feel:
Noise.
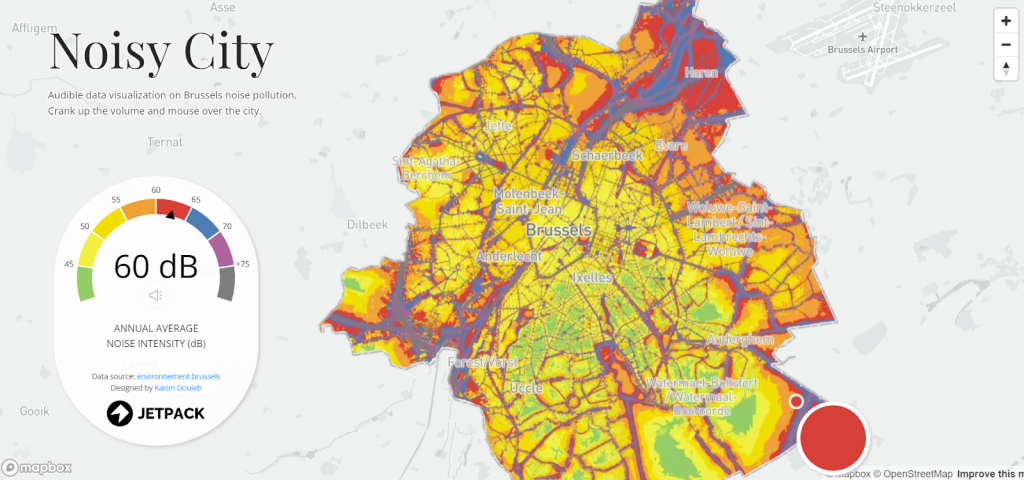
Whether it’s the hum of a nearby freeway, planes overhead, or even a constantly barking dog, noise shapes how people experience space. And thanks to new datasets and sensors, we can finally measure it.
When I started playing with open-source sound data from urban studies and transit departments, a few patterns stood out:
🔊 Noise is deeply unequal
Lower-income neighborhoods tend to be closer to highways, freight corridors, or airports. These areas often have fewer trees and less sound insulation. It’s not just annoying—it’s unhealthy. Chronic noise is linked to stress, heart disease, and poor sleep.
🏙 Quiet ≠ Safe or Livable
Interestingly, some of the quietest neighborhoods were also the most isolated—far from transit, amenities, or community hubs. That’s why noise should be analyzed with other data, like walkability or green space—not alone.
💸 Sound affects value, even if people don’t talk about it
Property values in quieter zones tend to rise faster—especially in gentrifying areas. That means noise data could be a hidden early signal for how a neighborhood might change.
🌐 Tools are catching up
Some cities are now building noise maps using sensors or even citizen-collected data. That’s the kind of layered info I hope to bring into tools like EcoScore—because livability isn’t just visual, it’s audible.
We all know what it’s like to live near something loud. But until recently, noise was something we could feel but not track. That’s changing. And when we add sound to the way we analyze neighborhoods, we get a clearer, fuller picture of what it’s like to actually live there.

Leave a comment