
There’s a saying that “data doesn’t lie.” But after a lot of digging and research, I’ve realized something more complicated: data doesn’t lie — but it doesn’t always tell the truth either.
Let me explain.
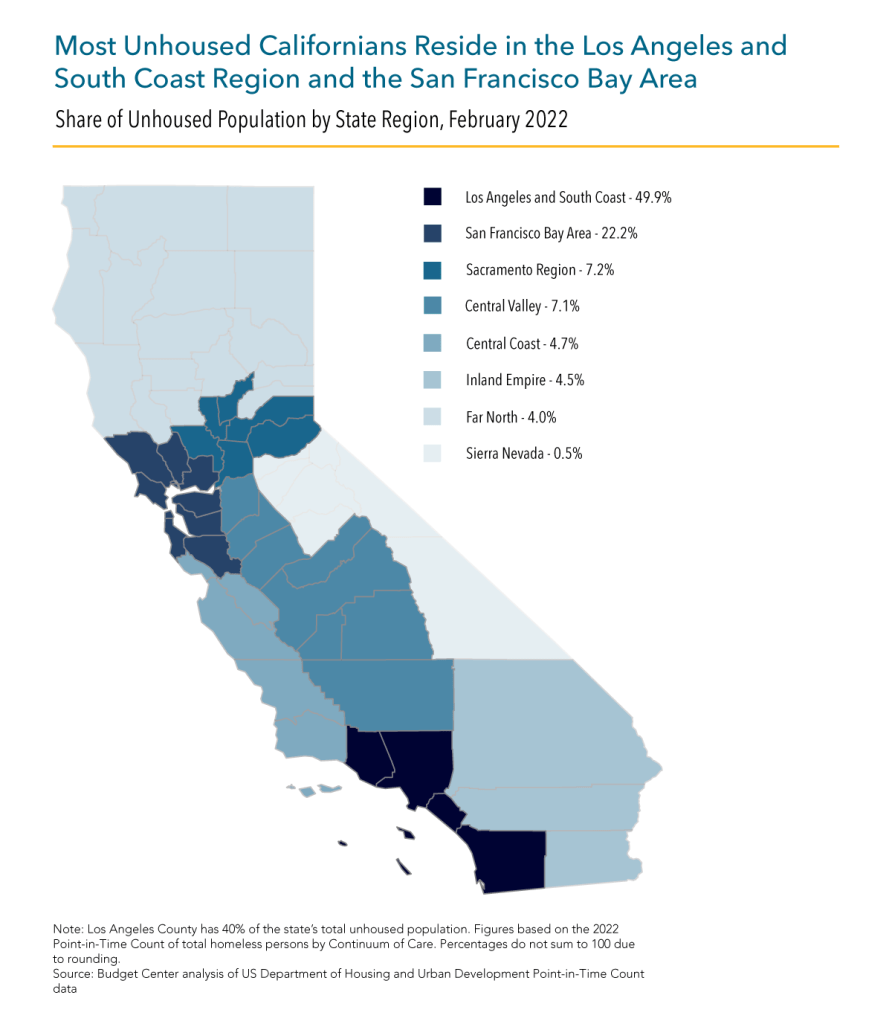
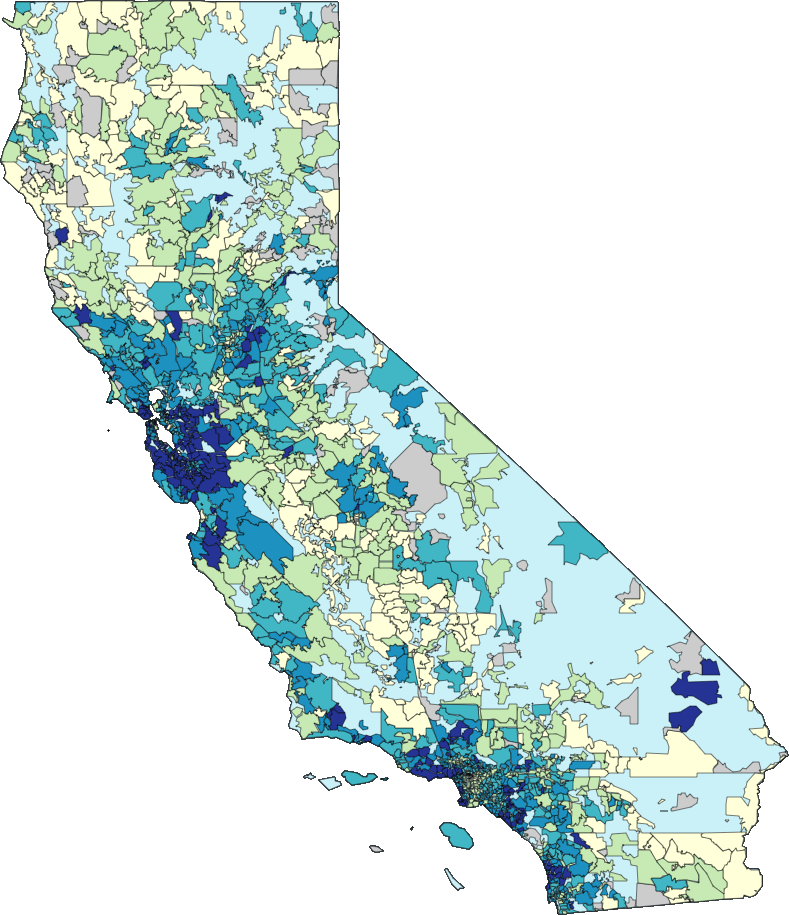
I once saw a map that showed average household income by ZIP code. On the surface, it seemed like a clear story: some neighborhoods were rich, others weren’t. But then I learned that one of the wealthiest ZIP codes on the map also had a large homeless population… and another ZIP code, marked as “low income,” had more stable housing and lower eviction rates than many others. The map didn’t lie — but it also didn’t show the full picture.
The right map shows ZIP‑level income differences, but as I learned, high‑income ZIPs can still have high homelessness or housing instability shown in the left map—meaning the picture is never quite complete.
That’s the tricky thing about data. It’s only as good as:
How it’s collected
Who’s included (and who’s not)
What’s being measured — and what’s being ignored
In school, we often learn how to graph things or build charts. But we don’t always learn how to question the data itself. Why is this the dataset we’re using? What stories might be missing? Are we mistaking “average” for “typical”?
That’s part of what The Data Lot is about. I’m not trying to publish perfect research papers — I’m just a student exploring how data fits into our lives. And the more I dig in, the more I realize that data isn’t just numbers or graphs. It’s a reflection of what we choose to notice… and what we don’t.
My goal here is to share visuals and tools that help people ask better questions, not just accept simple answers. Because at the end of the day, numbers matter — but how we use them matters even more.
